
Want to know what current MUI trends you should be on the lookout for in 2023? Curious about what this means for the remainder of the year? We’ve put together a presentation of local MUI trends through April 30. We included projections about what the entire year could look like if the current trends continue.
Current Numbers By Category & (Year End Projections)
Notable Highlights
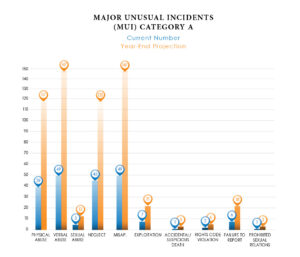
- There was a significant decrease in the number of overall categories in April, especially in Category A.
- Only 6 Physical Abuse filed in April, as compared to a previous monthly average of 11. Neglect also down with 8 filed in April compared to a previous monthly average of 12.7.
- Most other categories were either similar toprior monthly averages or slightly less.
- Among Category A’s, Misappropriation and Verbal Abuse are our highest categories both at 49, followed by Neglect at 46 and Physical Abuse at 39.
- Verbal Abuse, Neglect and Misappropriation are on pace to exceed 2022.
Want to see more? Download the full 2023 Q2 MUI Trends PDF
Questions or Suggestions?
If you have additional questions or suggestions on how to address these MUI trends, please reach out to MUI Senior Manager Wayne Hershey at or IA analyst Matt Klink. Together let’s keep people safe.
